BACKEND PROJECT
"To create a fully functional database for a tech business using SQL Server and visualizing insights through Power BI dashboards."

Project Objectives
For this project, instead of selecting a pre-existing dataset to analyze, I decided to create my own. I populated it with randomly generated data and later visualized it using Power BI. To design the database structure, I used QuickDBD, which helped me define the tables and their relationships. After finalizing the design, I exported the schema and implemented it in Microsoft SQL Server Manager.
Once the tables were created, I established the necessary relationships and made adjustments as needed. Next, I filled the tables with data using Excel's “RANDBETWEEN” function and a VBA Macros. The data was generated based on custom lists that I compiled, which will be explained later in the project.
The dataset represents a backend structure for a tech store that assembles custom PCs and laptops. The store purchases components and builds different models across various categories, with each model requiring specific parts. The database facilitates data collection from multiple business sectors, including:
- Orders / Sales: Sales details such as Items purchased, Quantities, Customer Details, Order Date.
- Customers: Customer's details such as Name, Address, Age.
- Items: Items sold by the company.
- Components: Parts used to assemble each item, varying in type and quantity.
- Inventory: Helps manage stock levels for components.
- Staff: Tracks employee costs and assigns staff to orders.
This structured dataset serves as the foundation for analyzing various aspects of the business, providing insights into sales, inventory, and workforce management.
Questions (KPIs)
- What are the most sold Items and their average price?
- Which Components are used the most, their average cost and categories?.
- What is the stock level of each item?
- Total Items sold and the company's profit with them.
- Which Customers are buying the most and when?
- What are the costs with the Staff how much those affect the company's profit.
Process
- Used QuickDBD to create the dabase schema and all the tables.
- Adjusted the Datatype, Keys and Relationships for all tables.
- Generated random data to fill the tables using VBA and RANDBETWEEN functions in Excel. (Code in Github Repository)
- Created multiple custom queries to use in PowerBI and be able to feed some of the visuals. (Code in Github Repository)
- Created Visual Representation for for all areas (Sales, Items, Components, Staff).
Dashboards
Project Insights
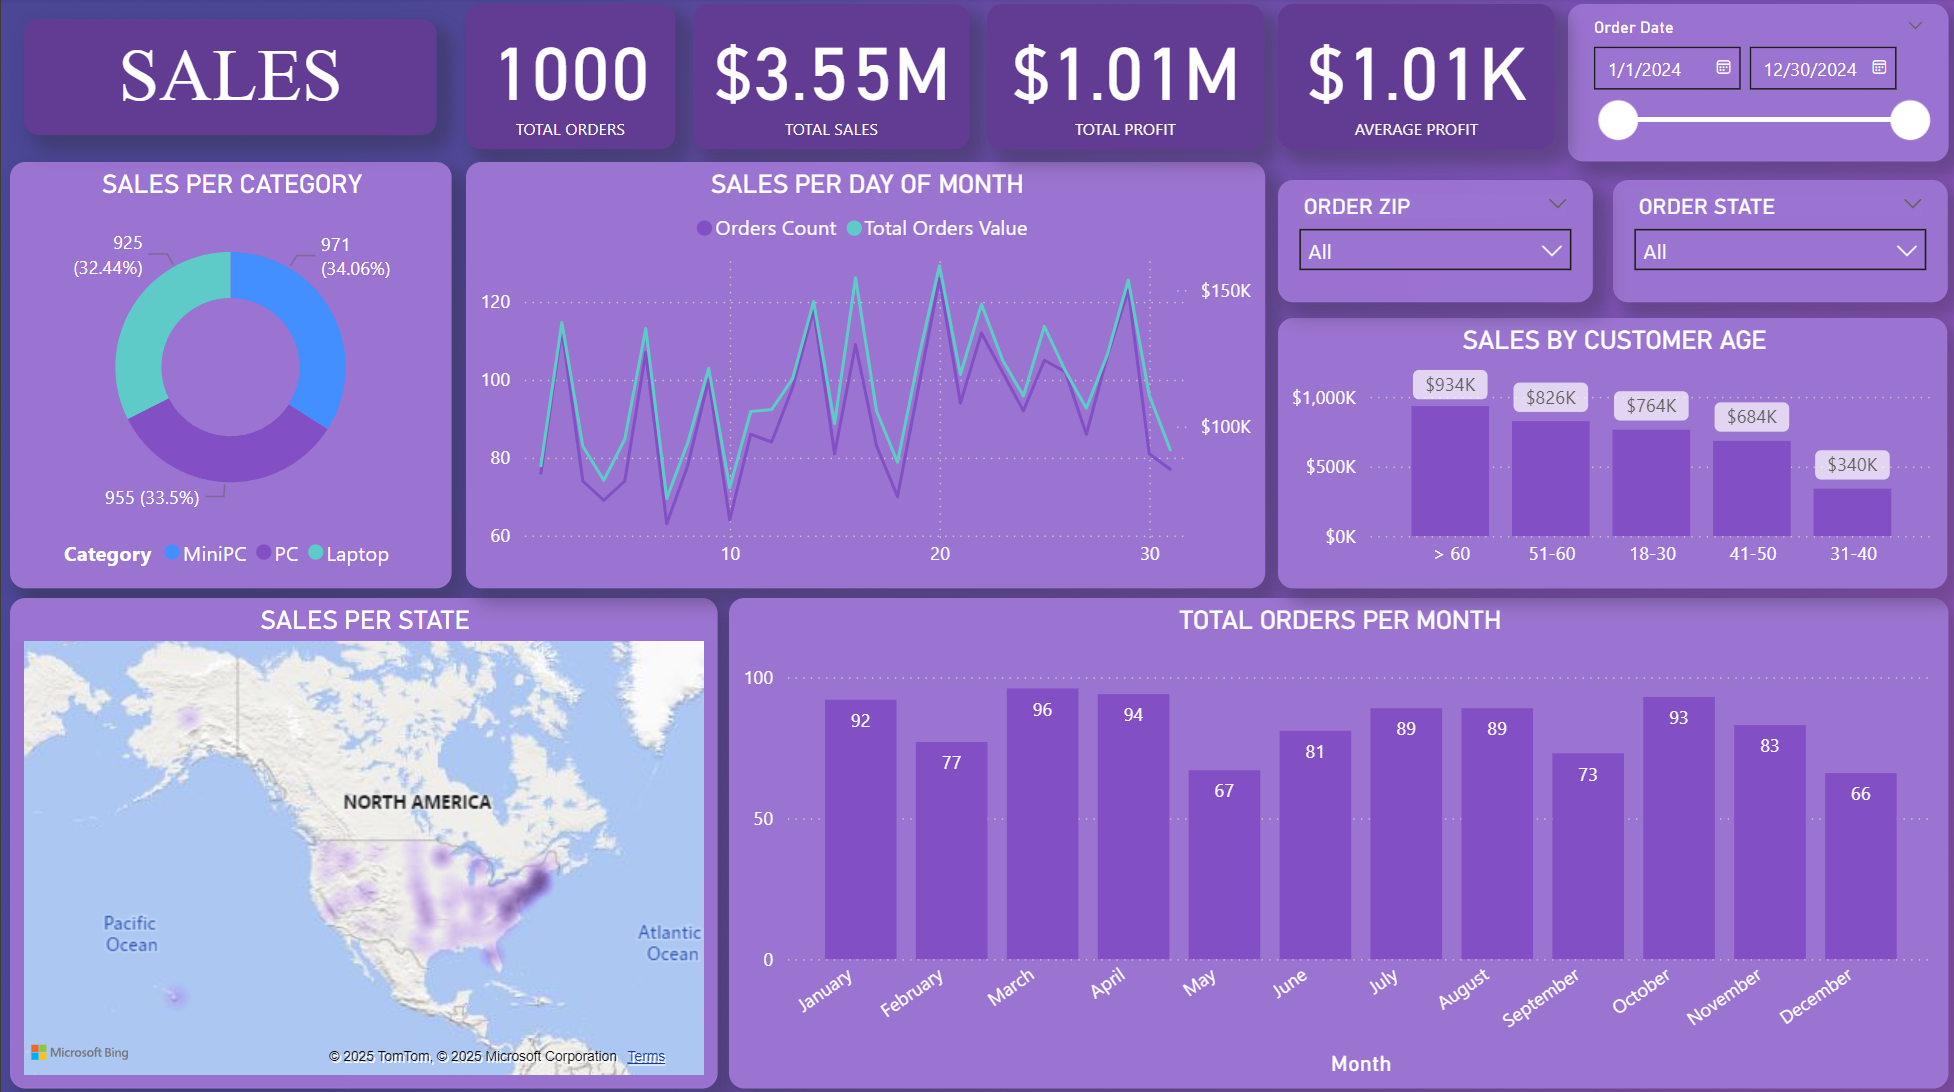
- There are a total of 1000 orders generating a total amount of 3.55 Million Dollars in Sales.
- Those 1000 orders made a total of 1.01 Millions in Profit..
- 50% of the orders were made from customers above 50 years old.
- March was the month with more Sales in number (96).
- Most of the Sales come from the Eastern States.
- 8 PM is the hour generating more orders in number and value.
- The Items Category is evenly distributed between 32% and 34%.
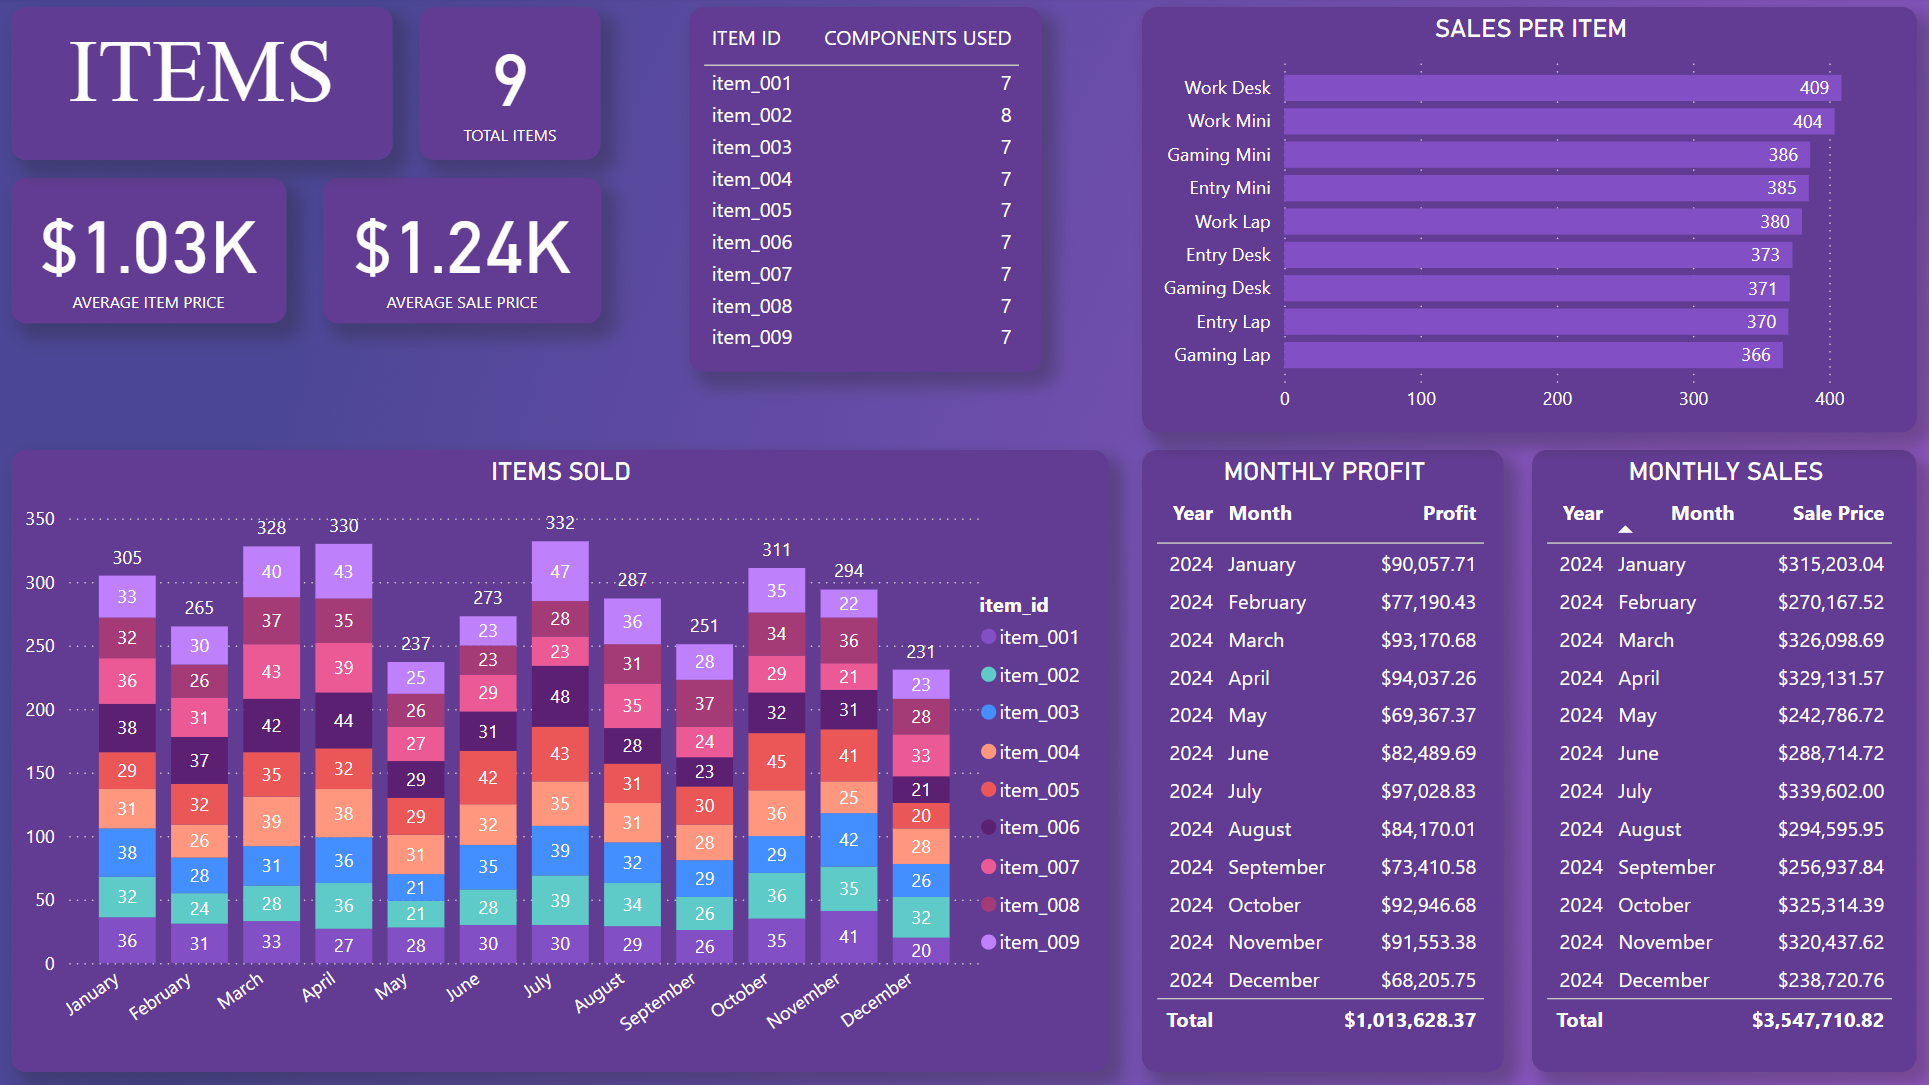
- The Average Item Price is $1.03K.
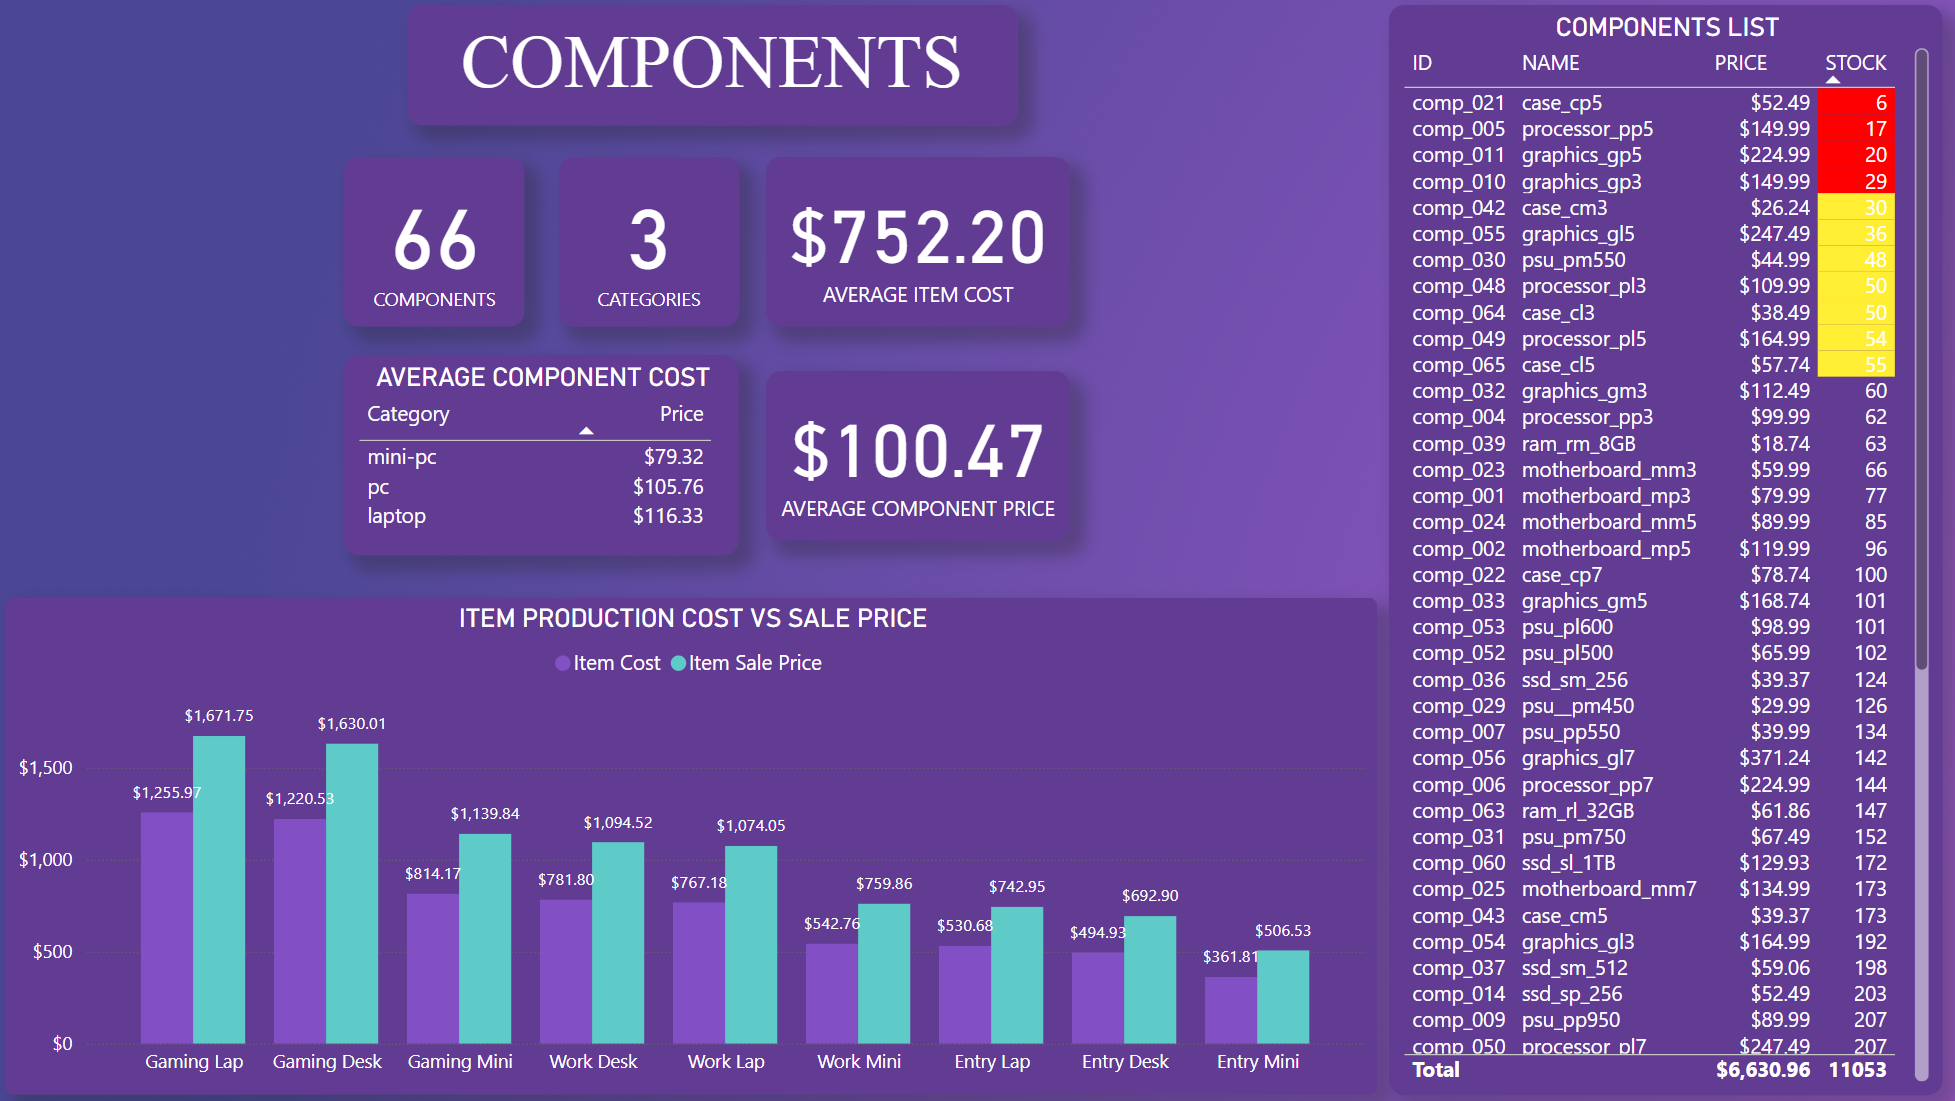
- The Average Item Cost is $752.20.
- The Average Order price is $1.24K.
- July was the month with more Items sold.
- July was also the month with biggest Profit ($97K) and biggest Revenue ($339 602.00)
- Work Desk, Work Mini and Gaming Mini are the items with more sales.
- Gaming Lap, Entry Lap and Gaming Desk are the items with lowest sales.
- There are a total of 66 Components distributed into 3 different Categories.
- The Average Component Price is $100.47.
- Currently, the company has a total of 4 Components with really low stock and 7 more close to it.
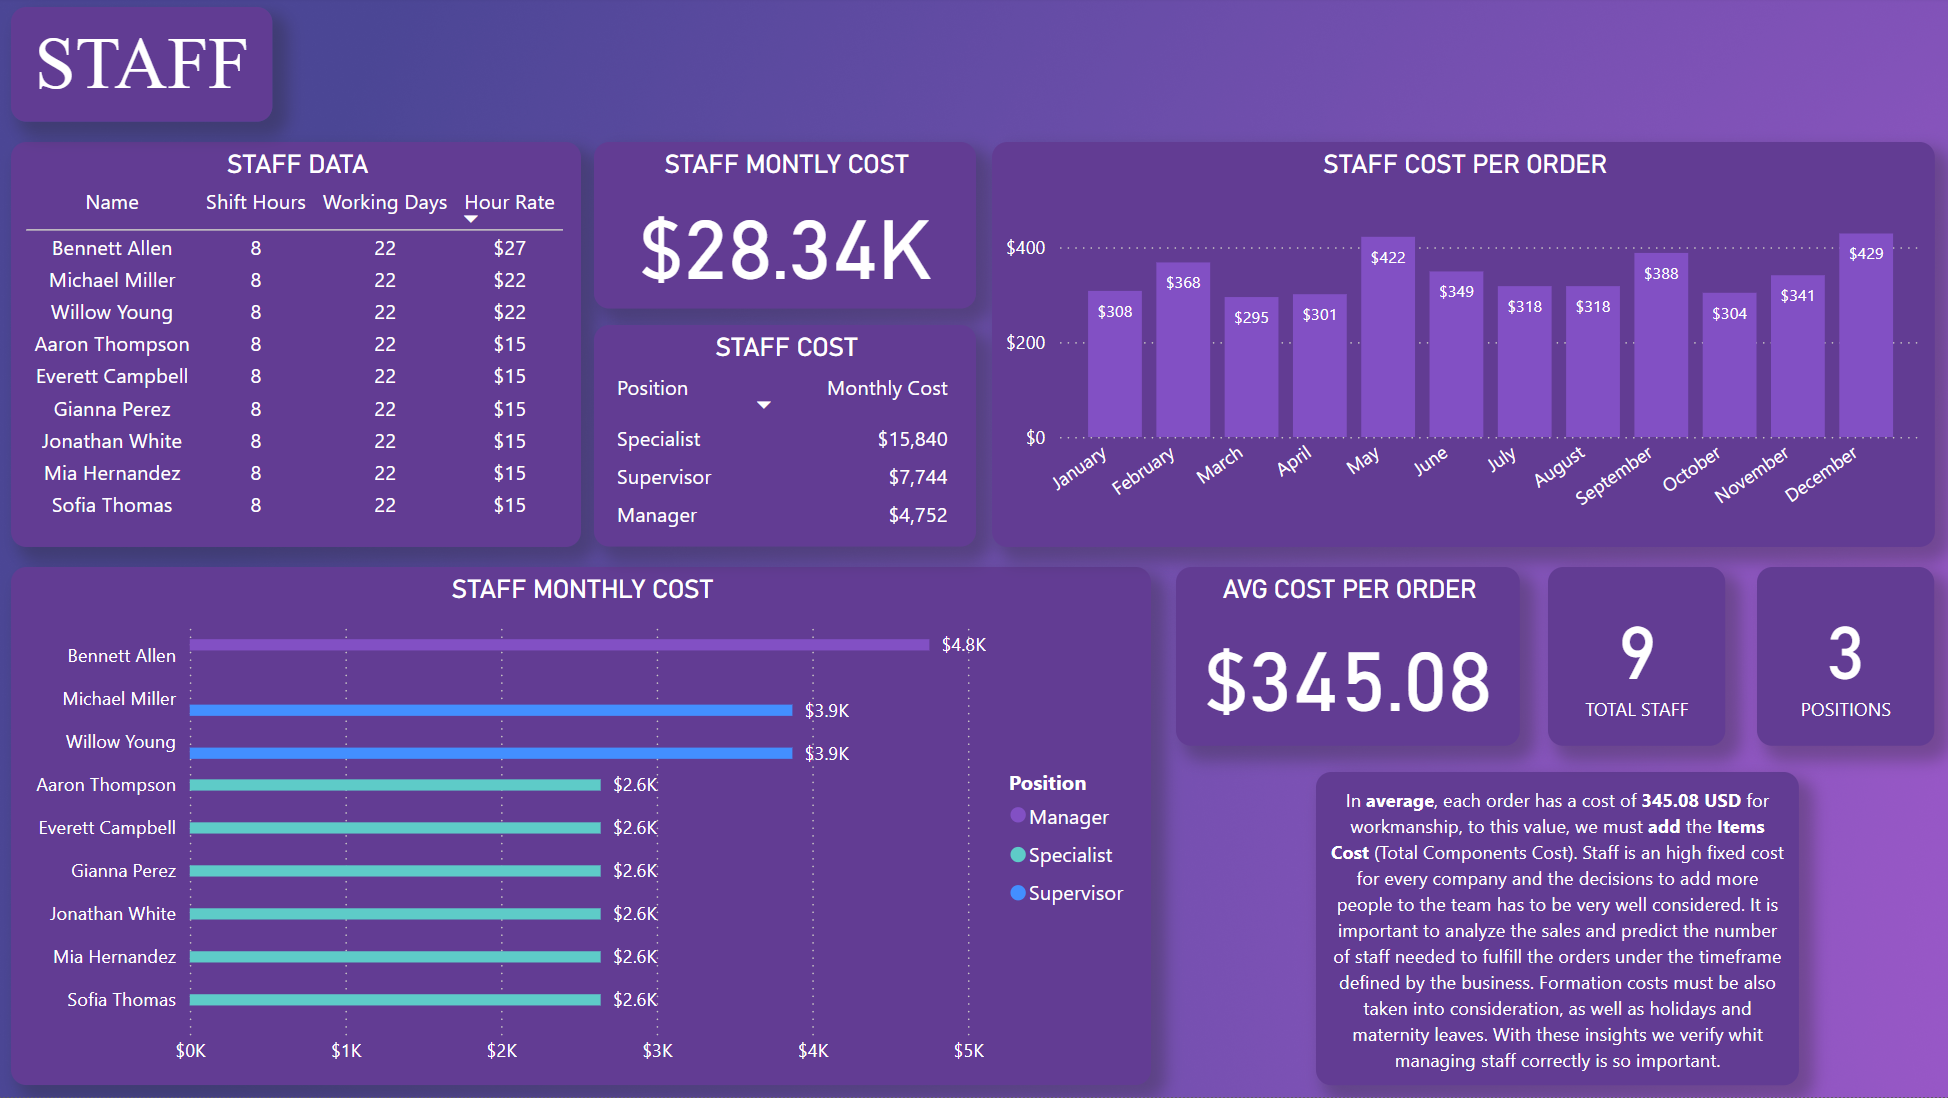
- The Company has currenty a total of 9 Employees distributed in 3 different Positions.
- The entire Staff represents a Monthly Cost of $28.34K just in Salaries.
- In Average, the Staff represents a cost of $345.08 per Order
Final Conclusion
When I started the project was far from imagining that populate the data into the tables with random data would be so challenging and time consuming. Being able to produce a dataset with data that could actually be used to represent visualy is really complex. Having to consider the relationships between the tables and columns, distributing the data in a way it is not evenly distributed was what took me more time. For that I used VBA which I used in the past but not for this purpose. Also, creating custom queries that link the data to later use in PowerBI was the most interesting step for me. Also explored the PowerBI function DAX to create some columns, and explored the possibility to convert SQL queries into DAX using AI. Overall was such an interesting project and one that surprised and challanged me the most. No Machine Learning was used on this one nor I needed to clean and transform the data since I was the one creating it, however, this is a project that gets pretty close to the reallity of many companies and the challenges they face daily.